Map Module
Create your maps directly within ESIA and make them dynamic by linking your icons to the status of your equipment. The variety of maps that can be created is limited only by your imagination, but here are the most popular:
- Wheathermap: visualize your WAN bandwidth usage in real time
- SpiderLatency / Latency Map: Displays the latency of all your remote sites
- Topology: Centralize your network diagrams
- Architect: Locate your cameras and access points
- Rack: Manage the available space in your server cabinets
- Service: Document the data flows required for your business applications to function
- DRP: Evaluate and document your Disaster Recovery Plan (DRP/DRP)
Directory management allows you to organize all your plans intuitively.
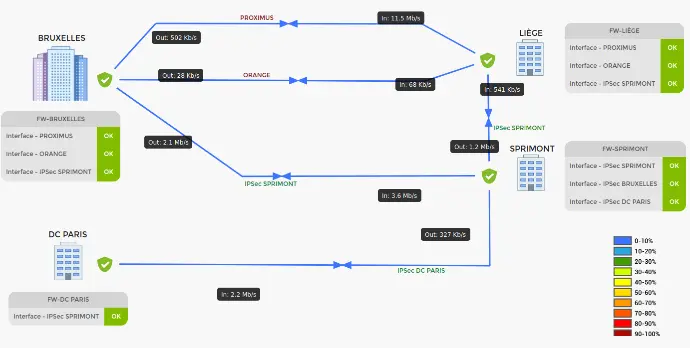
Wheathermap
A weathermap is a visual representation of your network usage that shows the inter-switch or inter-site bandwidth utilization rate.
This provides a quick overview of your network status and available bandwidth.
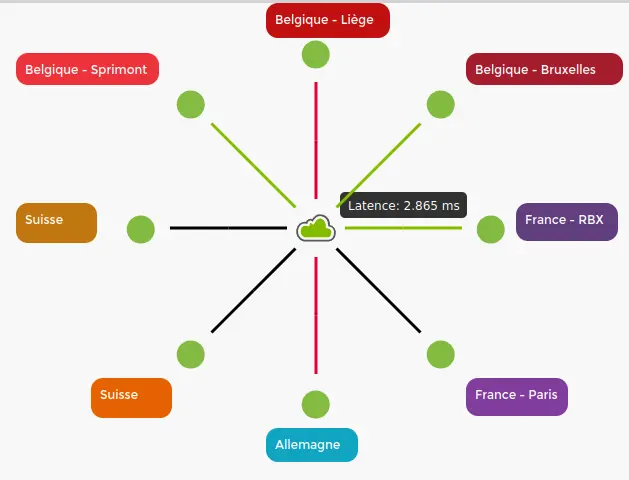
Latency
Spider latency diagrams allow you to quickly view the status of your connections between sites by showing the response time of a ping request.
Links responding with acceptable latency are shown in green, while links with high latency, packet loss, or complete disconnections are shown in red.
This view is ideal for adding to a dashboard.
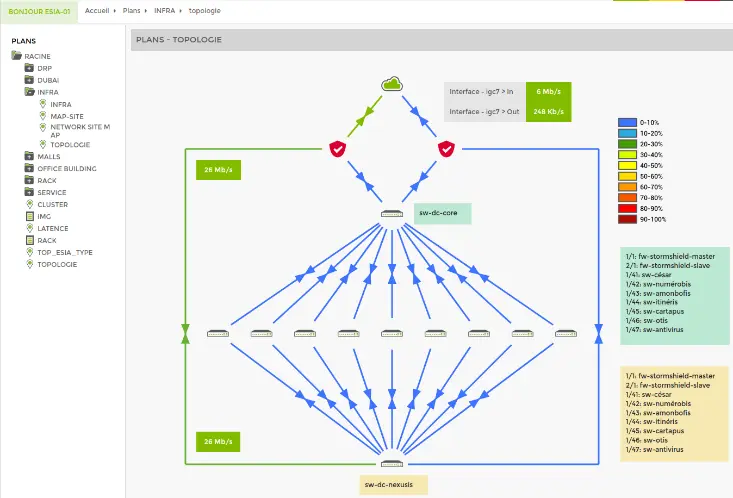
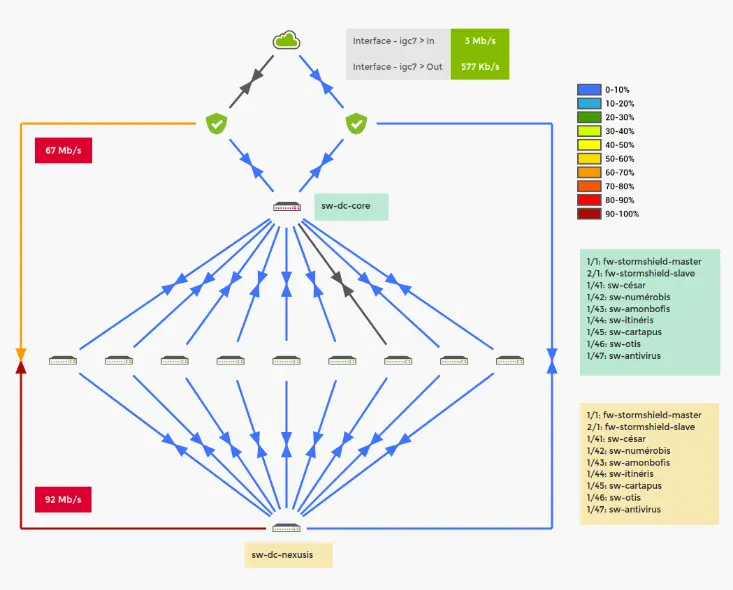
Topology diagrams
Centralize your network documentation within Esia. Create your network diagrams directly in our applications to ensure you always have an up-to-date version accessible to everyone through a web interface. No need to use third-party software or cloud sharing.
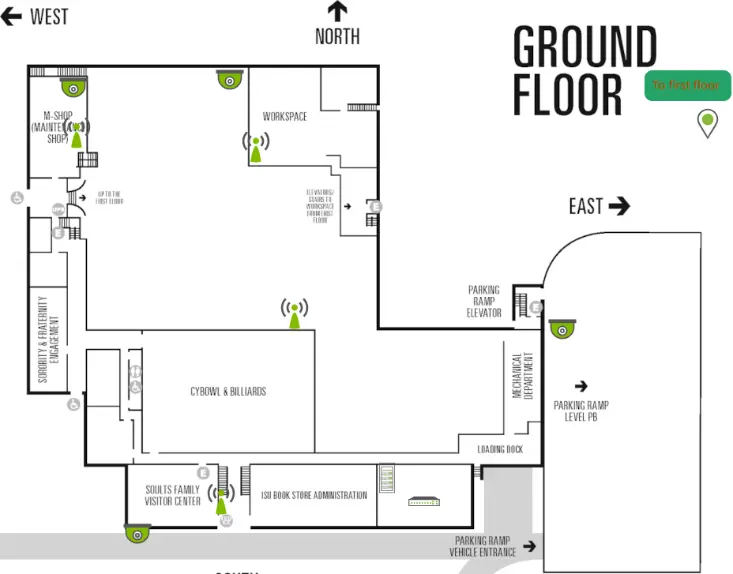
Architectural Plan
You can directly upload JPG or PNG images to indicate the location of your cameras and access points on your plan, making it dynamic.
You can also position your racks and link the images to a server rack plan.
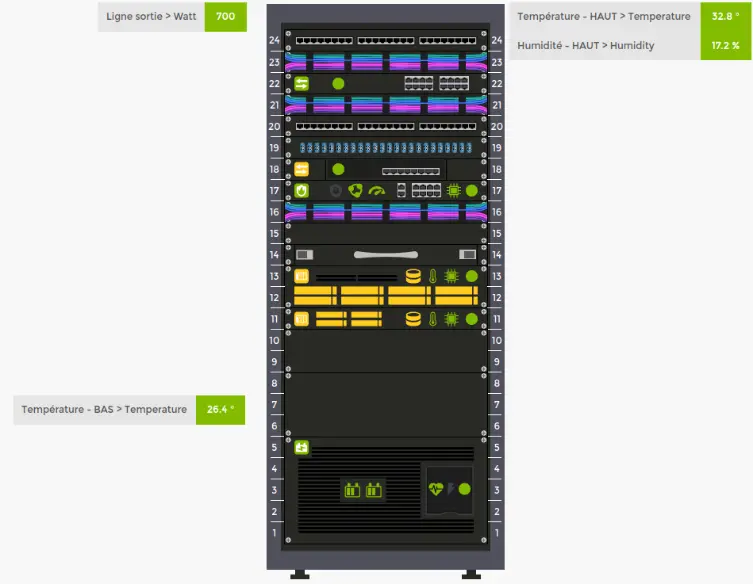
Rack
View your server racks clearly and centrally using UPS systems or third-party sensors (Hwg, AKCP, etc.). You can display the power consumption and temperature of your server racks.
Each element, such as your switches, servers, or UPS, is clickable and will redirect you to your monitoring node with the status of all your services.
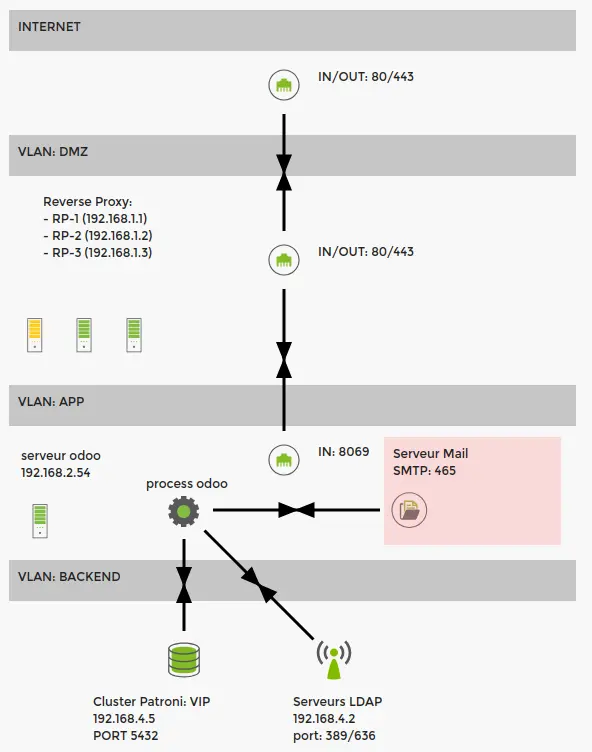
Service Plan
You can document your application flows directly through Esia and thus see, in a single view, the interactions between your servers, sites, and applications.
On the right, you can see the status of your proxy cluster located in the DMZ, which communicates with your ERP located in your "application" zone, which also contains the monitoring of your email service.
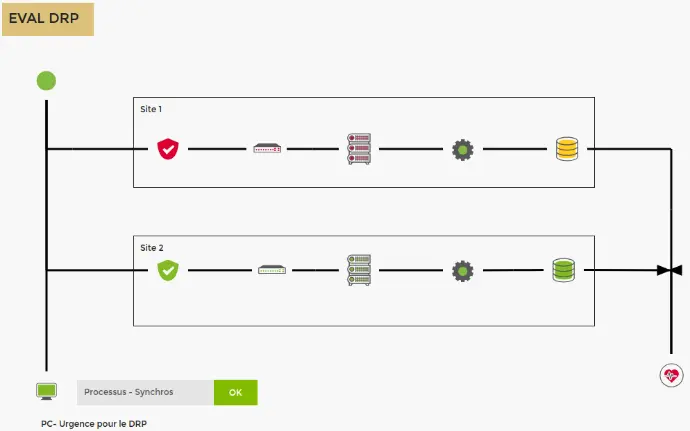
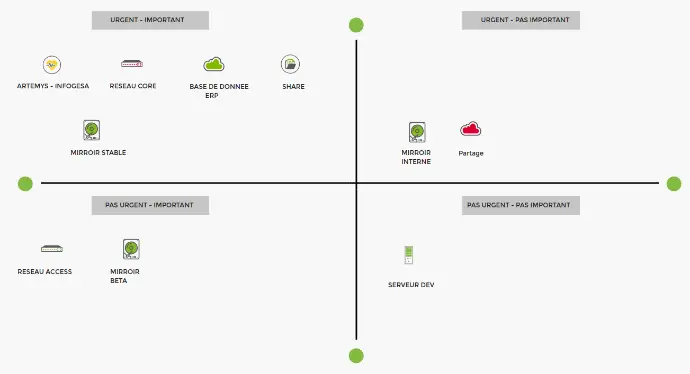
DRP: Evaluate and Document Your Disaster Recovery Protocol
You can use monitoring of your firewalls, switches, hypervisors, and backups to develop an evaluation plan for your DRP and see the impact of an incident on its implementation.
In the example on the left, you can see that Site 1 has a major incident, but Site 2 is operational. By clicking the heart icon in the bottom right corner, you can directly open your DRP (see our next section).
Maintenance of your DRP
By using node groups within Esia, you can create a dynamic disaster recovery plan. For example, as soon as a server is added to a "Critical Server" node group, you not only monitor it but it will also automatically be marked as a "production server" in your plan module.
Allowing you to organize your DRP according to your preference:
- The Eisenhower system
- The Deck system
- other
In your dashboards
Your plans can be integrated into your dashboards using the "plan" widget available there, making them even more dynamic.