Monitor your switchs
Compliance with standard monitoring protocols enables us to guarantee maximum compatibility with all manageable switches on the market.
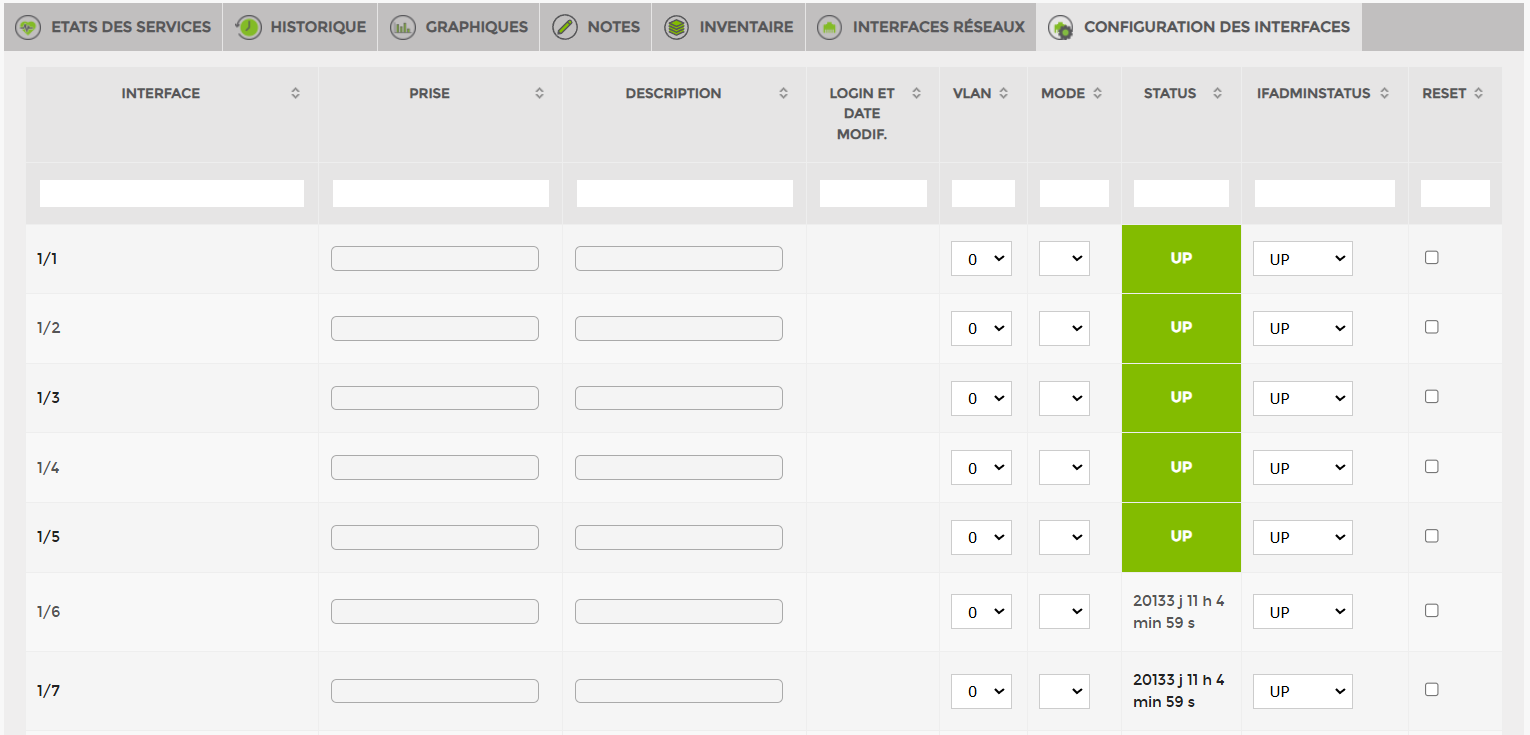
Each port on your switch is a dynamic object for ESIA monitoring.
Select this to view all available information in your interface. This view is available on all IF-MIB-compatible manageable switches.
Bandwidth
Monitor your bandwidth usage, whether on your internet, interswitch or traditional connections.
Our solution allows you to store up to 1 year of data and visualise points of congestion or network slowdowns.
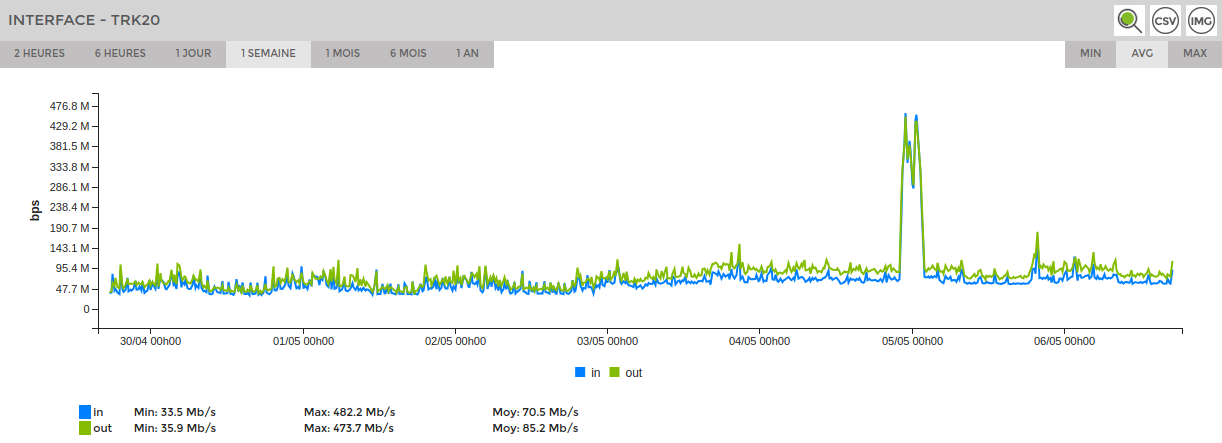
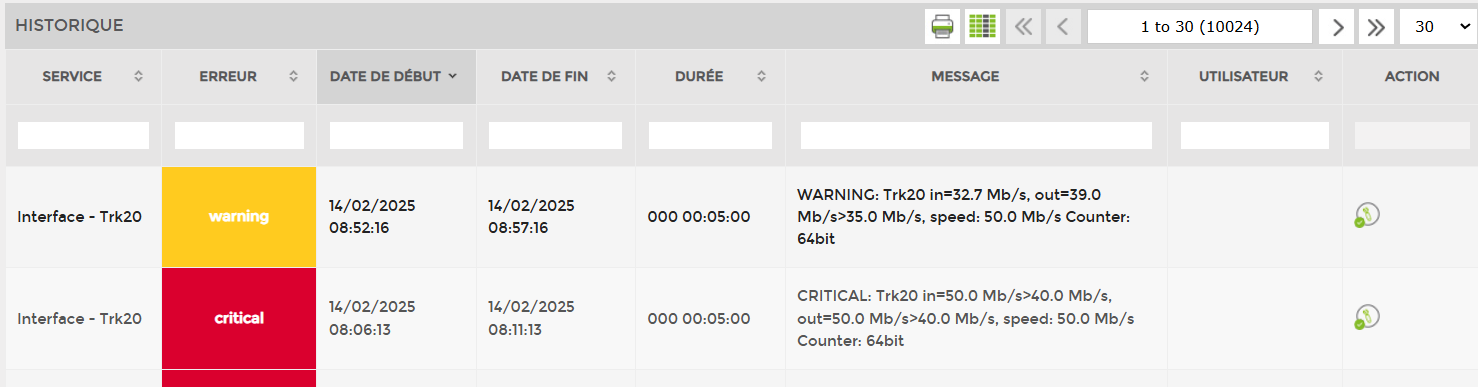
Congestion and history
With the bandwidth monitoring service, you can easily locate congestion points on your network and keep an accurate record of events occurring on your switch for one year (default setting).
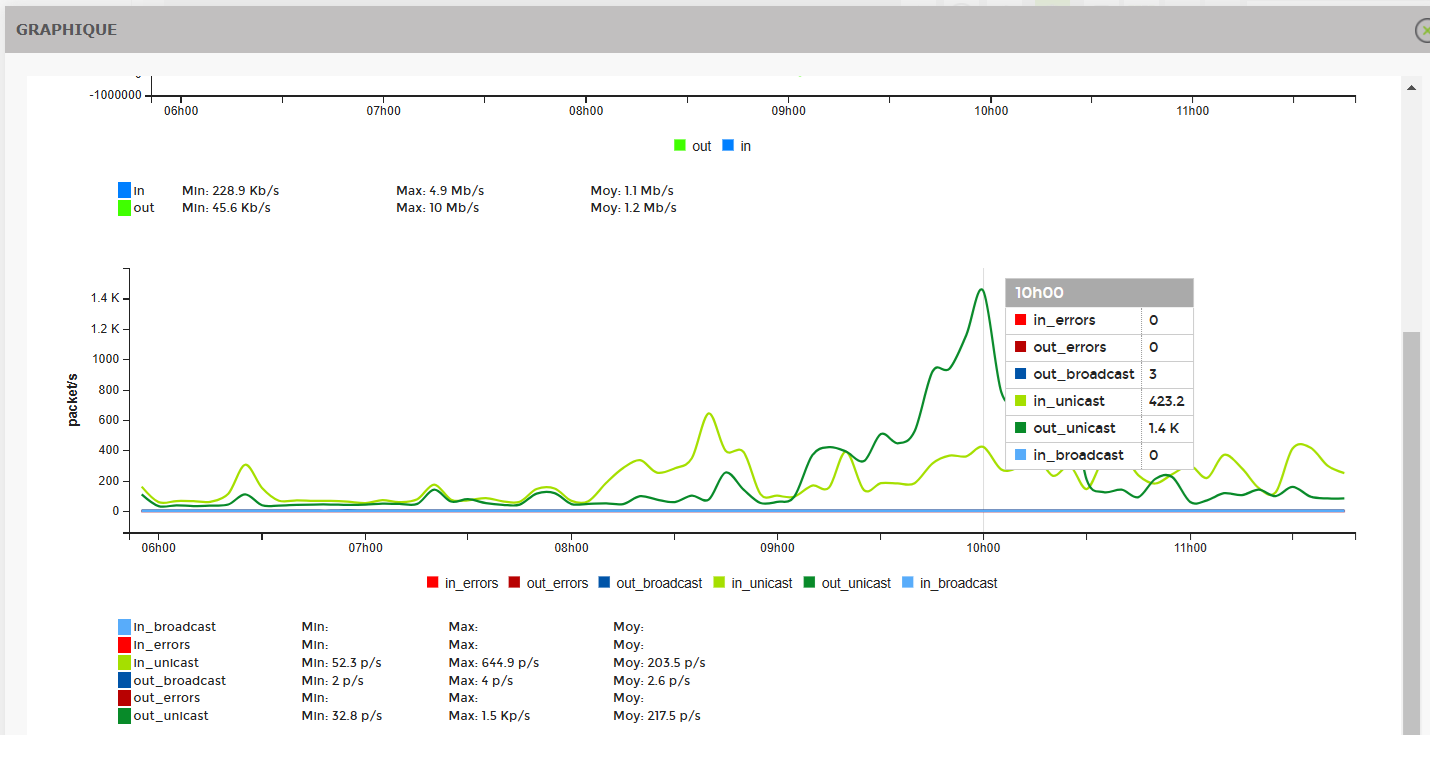
Broadcast
In addition to bandwidth usage, our solutions will enable you to view the type of traffic passing through your switches:
- Broadcast
- Unicast
- Error
Broadcast (a box with the post office) is a type of traffic that is necessary within the network, but in excessive quantities it causes slowdowns or malfunctions. Unicast is its opposite.
This data is available on all SNMP-compatible equipment (IF-MIB).
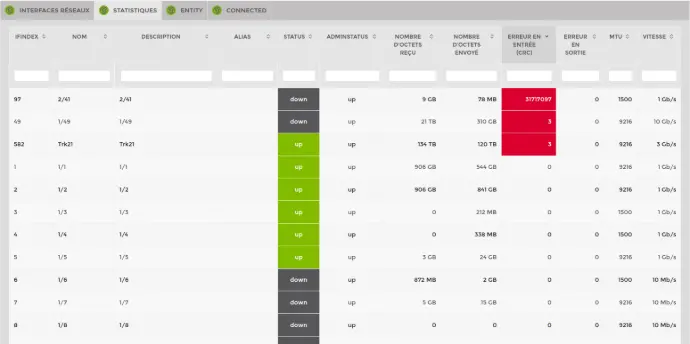
CRC error
Thanks to the interactive panel, it is very easy to display and sort CRC errors in order to locate them on a switch containing several hundred ports.
As shown in this image, where we can see that there were several thousand input errors for only 9 GB of traffic on interface 2/48.
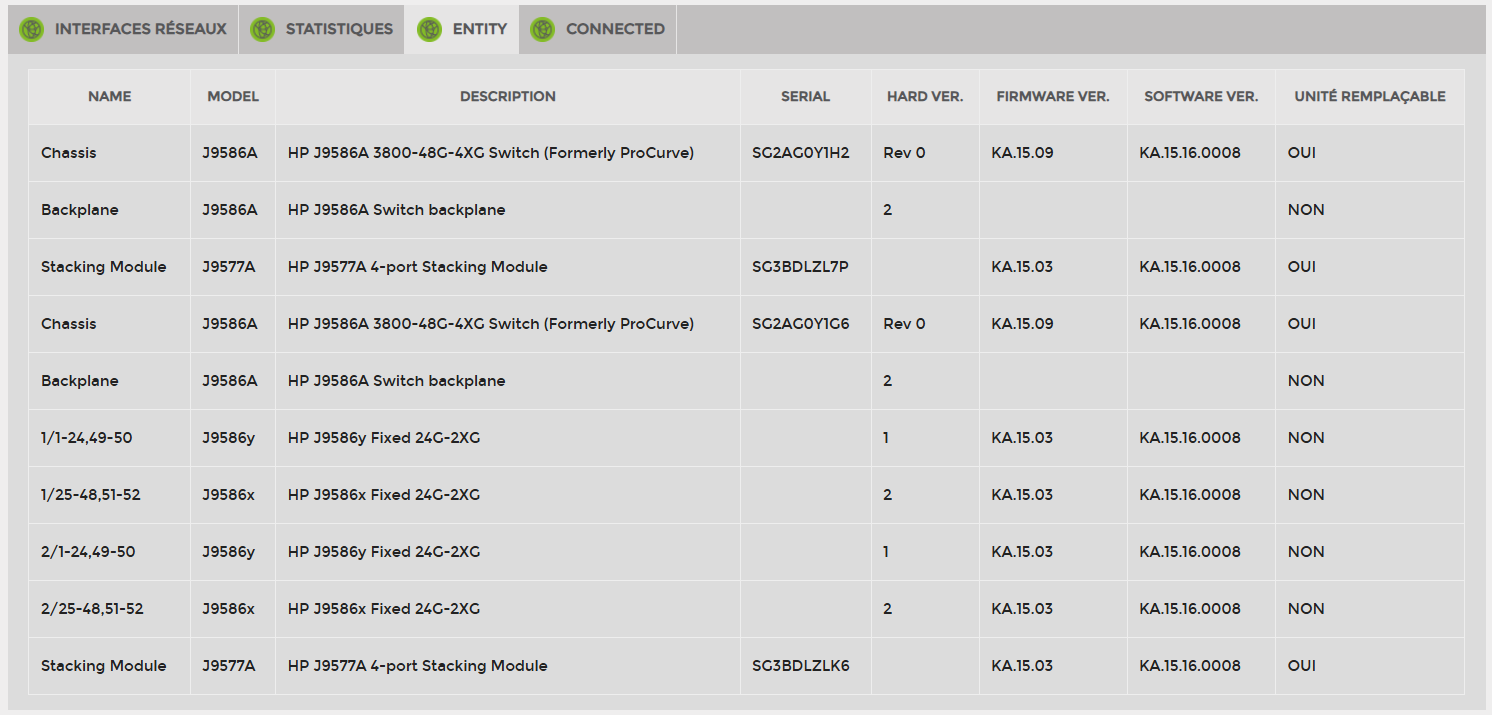
Inventory
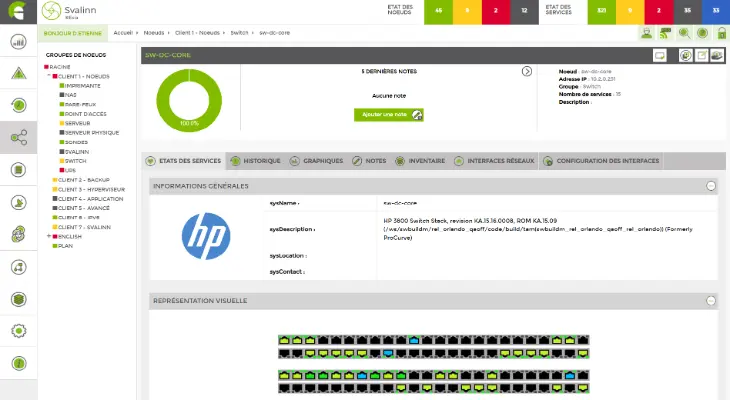
A complete inventory of your switch components is available.
The data available to you includes: model, serial number, hardware version, firmware version, software version, and component replacement options. This makes it easier to manage your inventory for NIS2 or ISO 27001. If you have a Svalinn licence, you can centralise your data even more efficiently using the inventory module.
Discovering your network
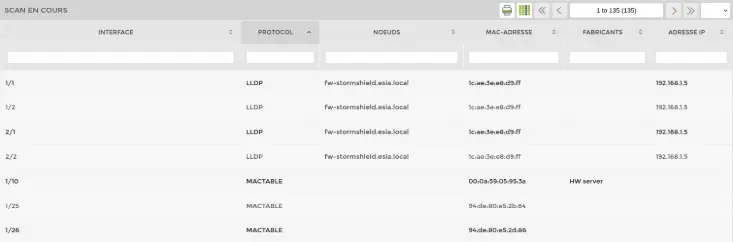
On your Heimdall and Mercury licences, you can activate network discovery. Using the LLDP (Link Layer Discovery Protocol) and CDP (Cisco Discovery Protocol) protocols, ESIA can automatically recreate the links between your compatible equipment (switches, firewalls, telephones).
Esia has also added a scanner that allows you to retrieve the MAC address table of your switches, enabling you to see which devices are connected behind their ports.

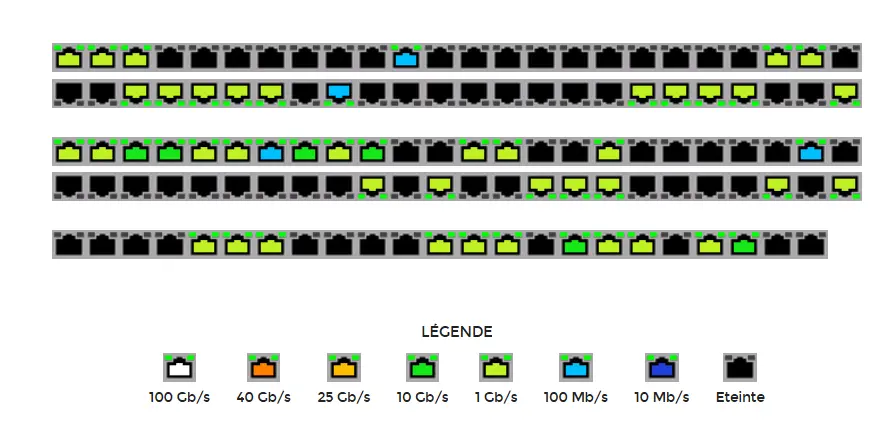
Clear visualisation
With the elements seen above, you have all the information you need to create your topology plans directly within our interface (plan module).
On your right, you will see a dynamic map of bandwidth usage (weathermap) between switches, firewalls and the internet. Replace the interface monitoring service with ping and this map will show you your network latencies.
ESIA allows you to configure your switches directly in its interface.
You can change the VLAN, mode, or reset a port.
This feature is available depending on the developments made to ensure the integration of specific equipment.