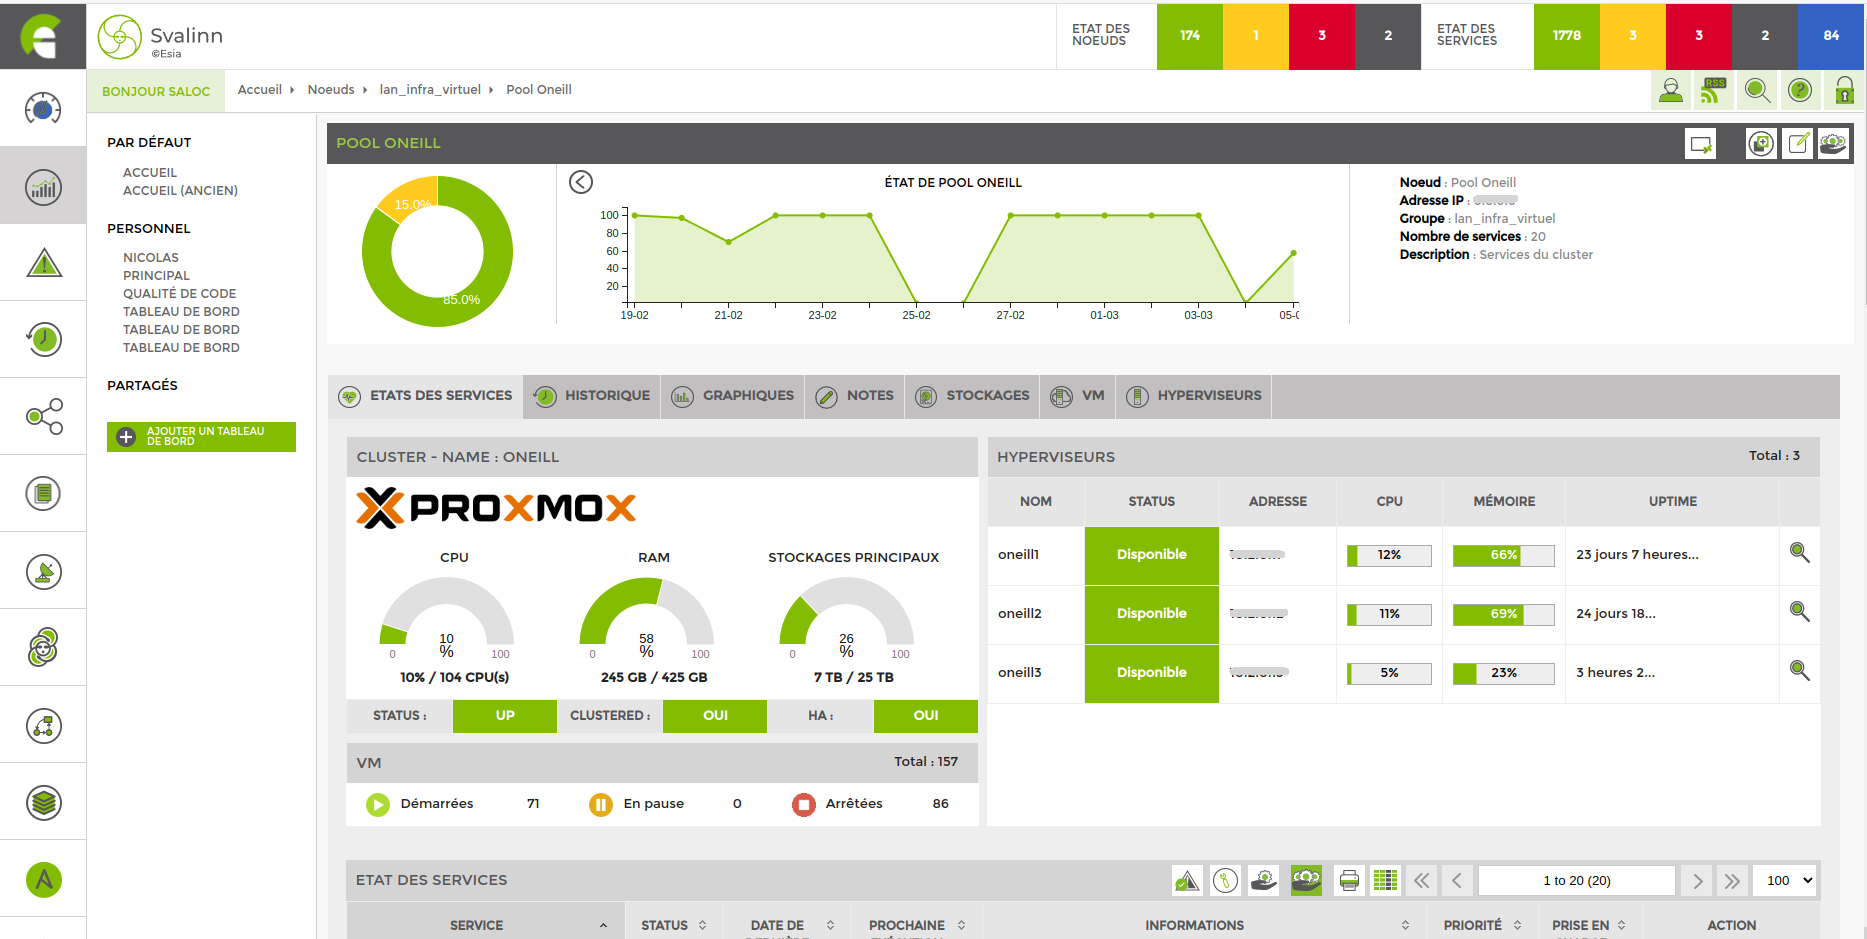
Hypervisor monitoring
Manage your hypervisors within a single interface and centralize the information essential to managing these systems' resources.
You can also monitor your virtual machines directly from your Esia interface. Our module is compatible with most solutions on the market: Proxmox, VMWare, Citrix XenServer, and Microsoft Hyper-V.
This module is available in our Mercury and Heimdall licenses. .


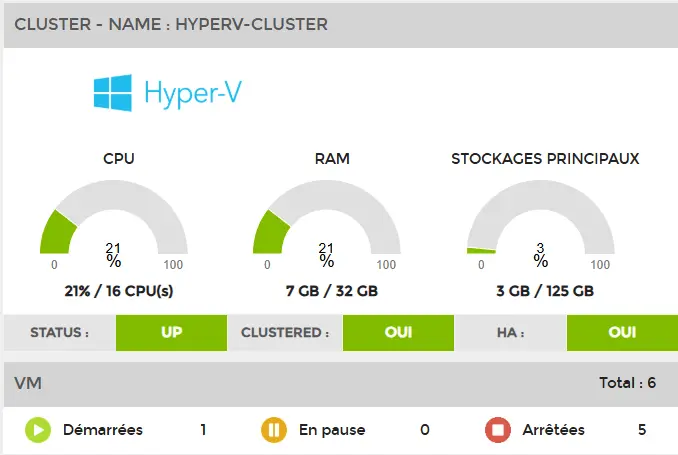
Supervision of your clusters' overall resources
The status of your virtualization cluster resources is centralized in our interface. The utilization rate of your various resources (processor, RAM, and storage space). The status of the cluster or the activation of HA (high availability).
Virtual machines (VMs) and their states—running, paused, or stopped—are clearly and simply displayed.
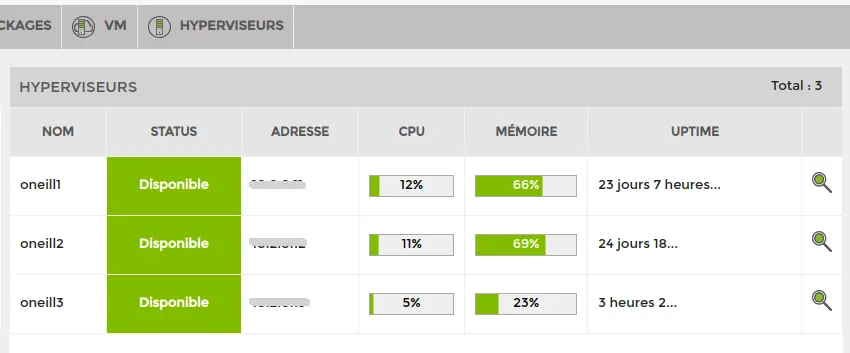
Guest status
Your various hypervisors and their resources are listed in a table showing the CPU usage level, memory, and uptime of each VM.
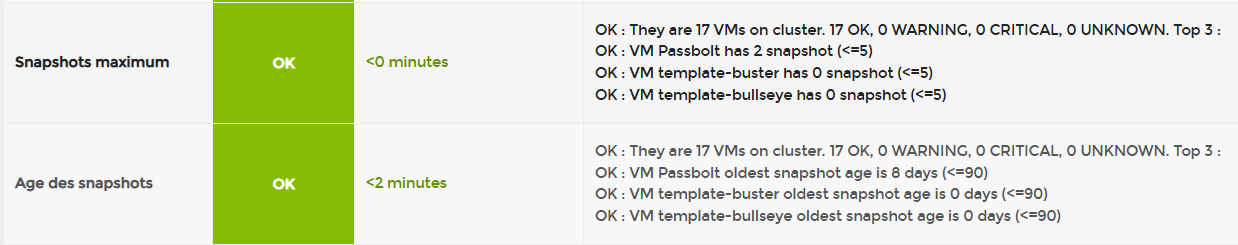
Snapshot management
Information that is very useful to system administrators, such as the number of SnapShots and their age, is clearly displayed in our interface.
It is no longer necessary to go through your virtual machines one by one.
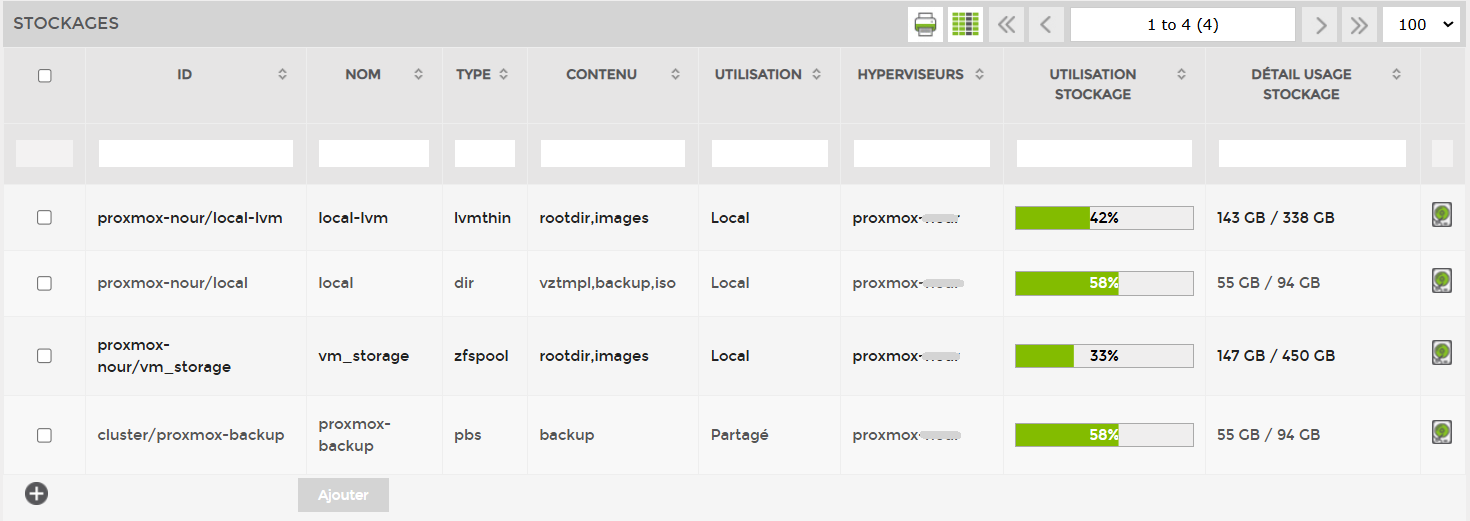
Storage and volumes
Monitor the usage of your storage spaces or local and shared volumes in a single detailed table. You can also configure email alerts to be sent if you exceed a certain threshold.
Here is a detailed list of information on all compatible systems
- ID
- Name
- Type
- Content
- Use: local, shared
- The use of storage spaces
Capacity planning
Via the “Report” module and its “Storage Space” section, you can view your current space usage, as well as get an estimate for the next three months.
You can plan your developments with peace of mind thanks to our capacity planning features.

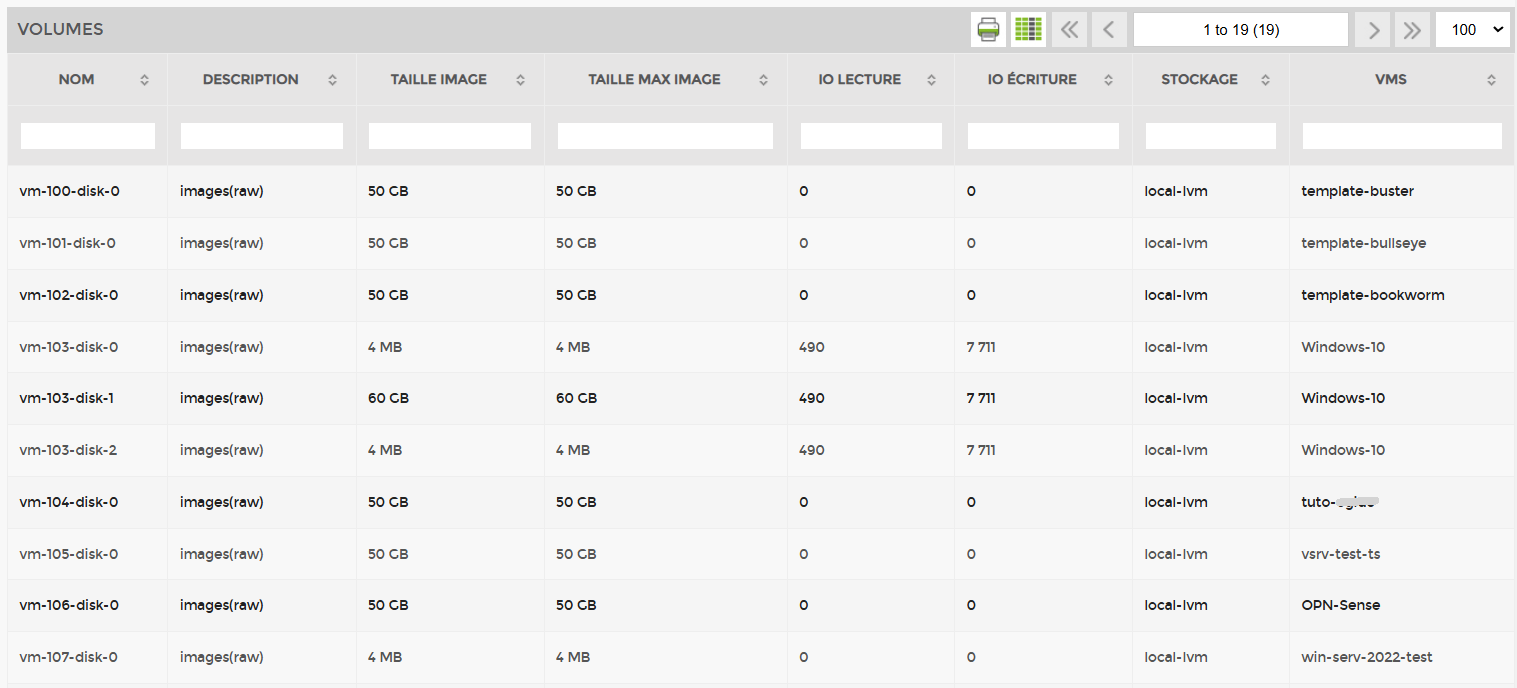
Disk contents
All disks are displayed in the storage panel, along with the virtual machine associated with that disk and its read and write IO rate.
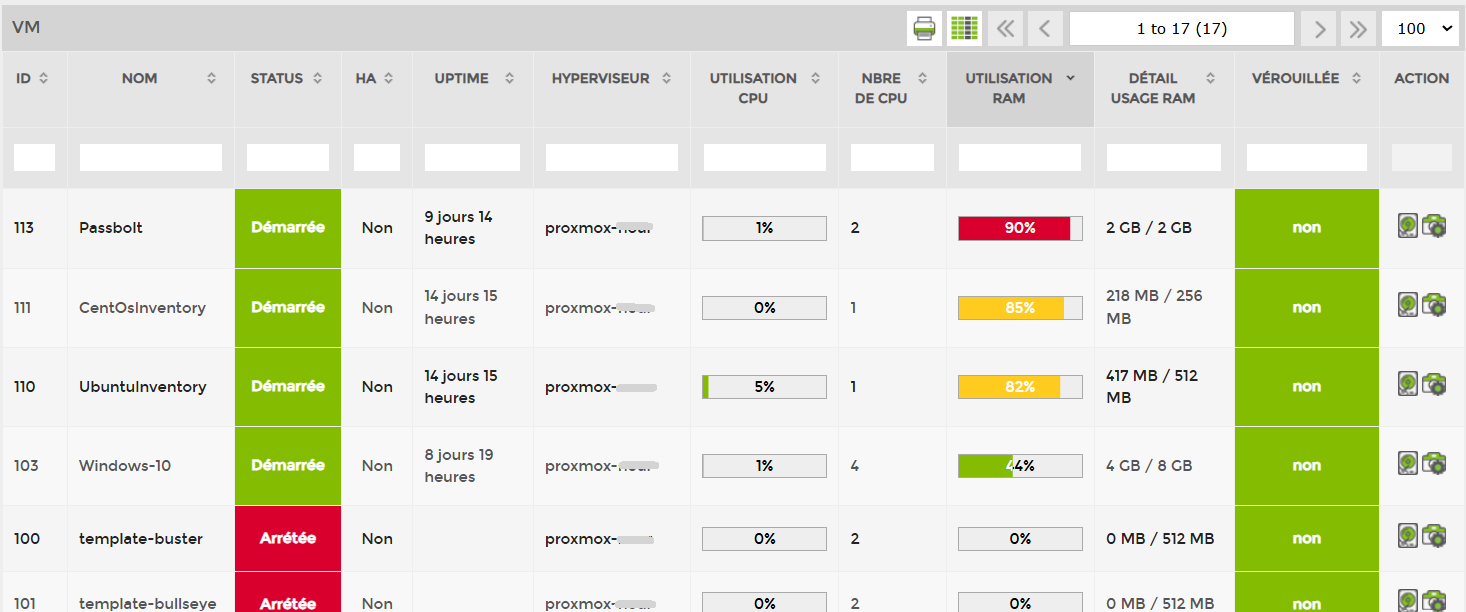
Virtual machine
Each of your virtual machines, their resources, and their status can be viewed in a table showing CPU usage, the number of CPUs allocated, RAM usage, whether they are locked or unlocked, and the possibility of performing actions such as restarting the VM, viewing volumes, and displaying VM snapshots.
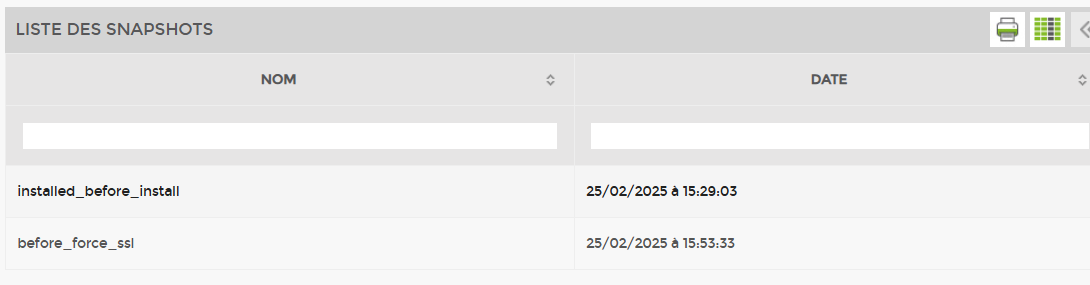
Snapshots of a VM.
You no longer need to log in directly to your central management platform (Vsphere, Prism, XenCenter, etc.) to find out the number of snapshots and their creation dates.
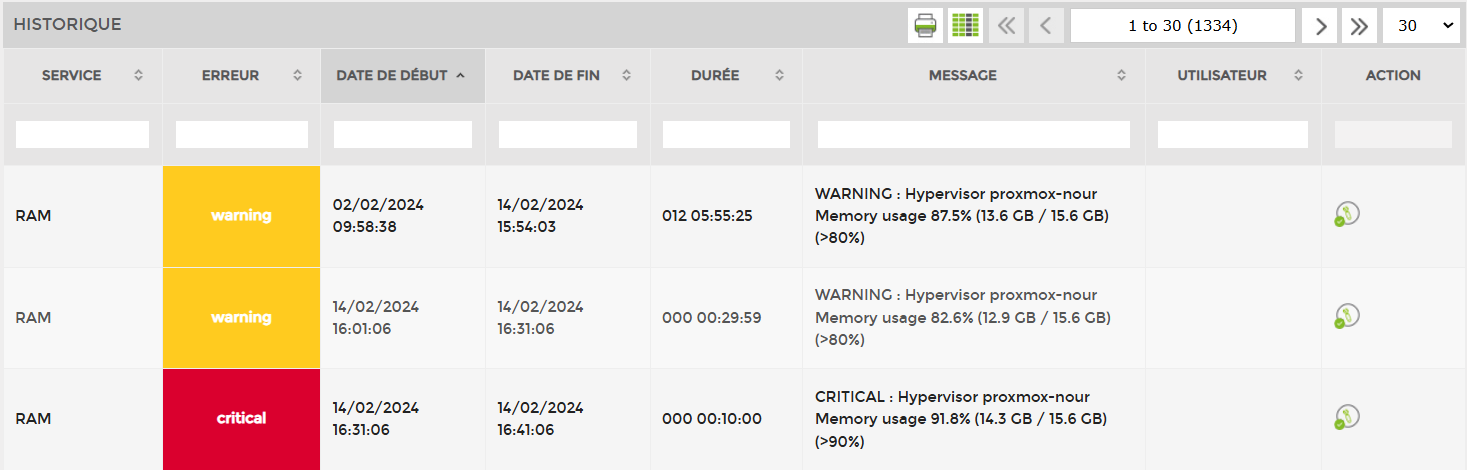
History
The complete history of all alerts, retained for a minimum of one year, is available to you. This information can be sorted and displayed according to your criteria. You can also export this information using our automated reporting module.
Graphic
ESIA generates graphs based on a whole set of data made available to you. You can define the information to be displayed in graphs and integrate them into the automated reports generated by ESIA.
