Monitor your servers with ESIA.
Our server monitoring plug-in allows you to monitor the hardware, software and services that are important to your company. Thanks to SNMP, Powershell or SSH, all operating systems on the market are supported.

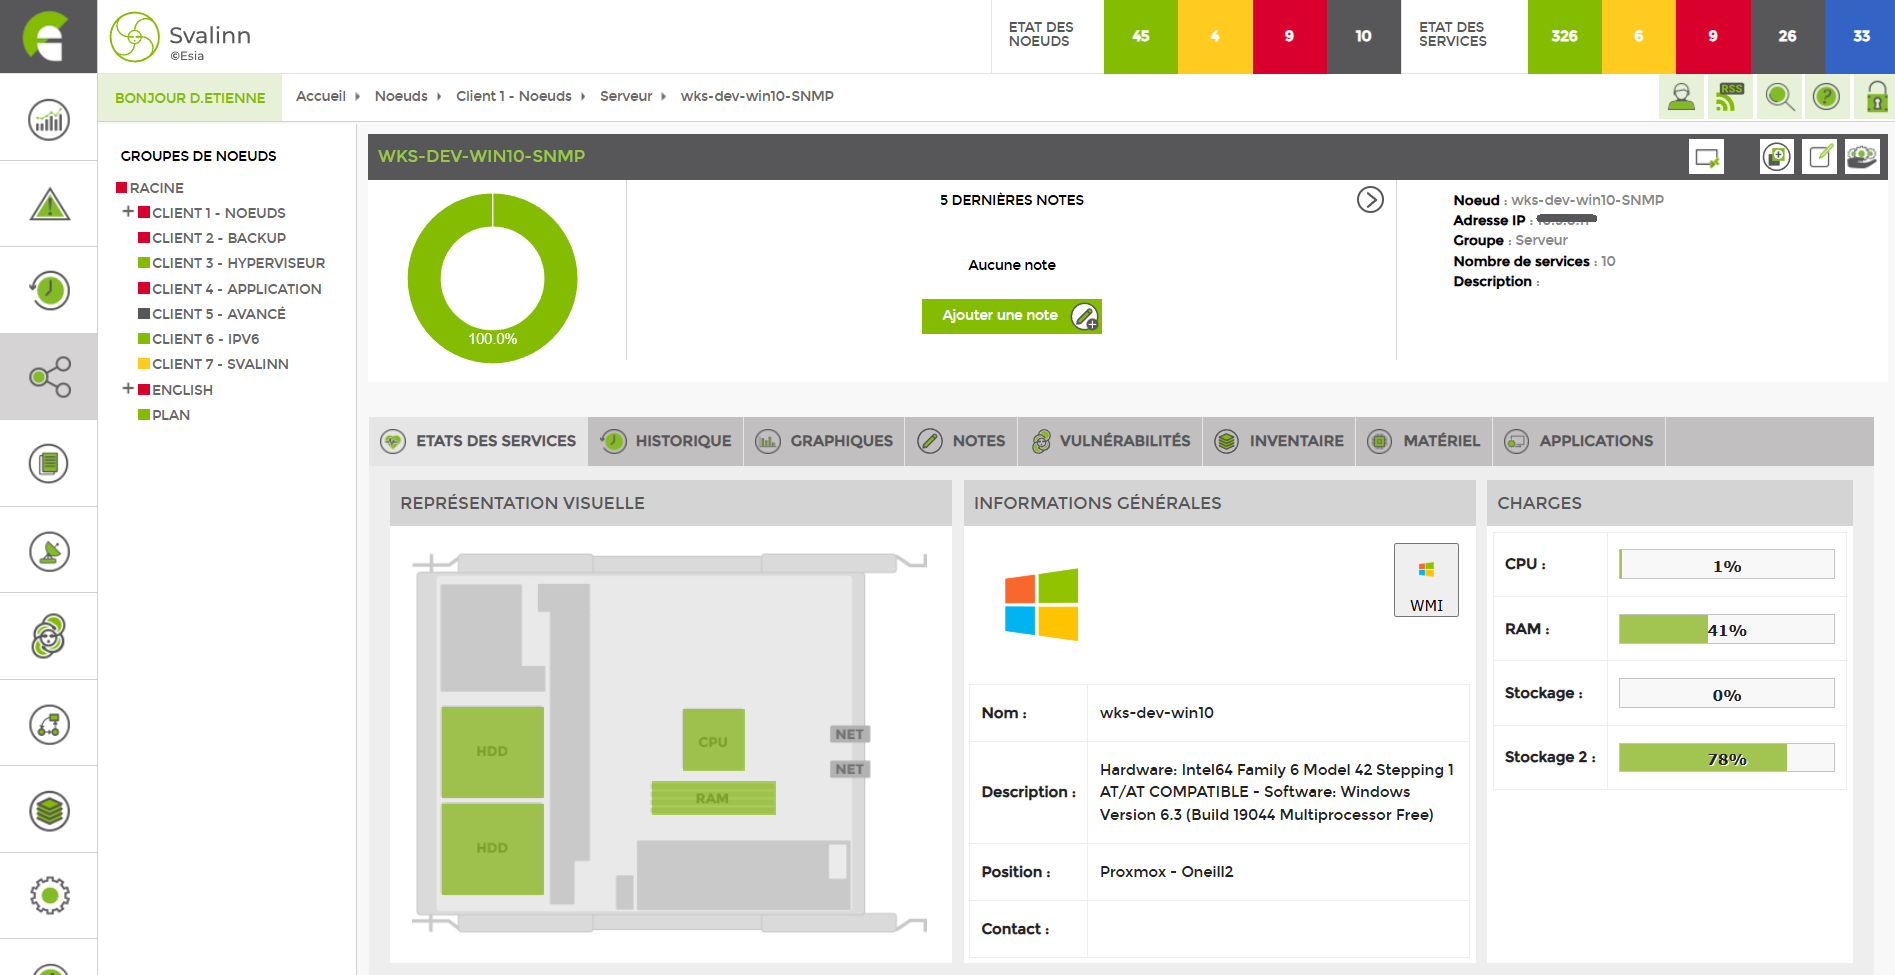
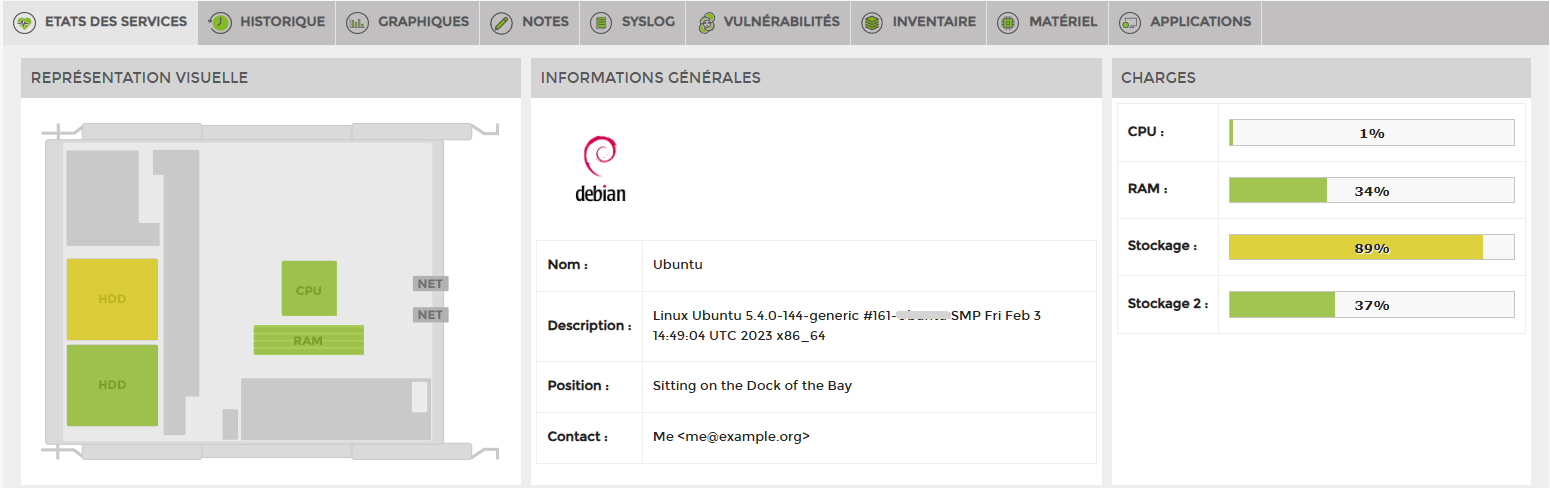
State of health
Our interface provides you with essential information about the main components, CPU, RAM, disk space, and the OS. A description and other information allow you to organise your server infrastructure.
Server monitoring plug-ins are available for you to choose from, allowing you to select the information you wish to monitor from over 3,000 available plug-ins.
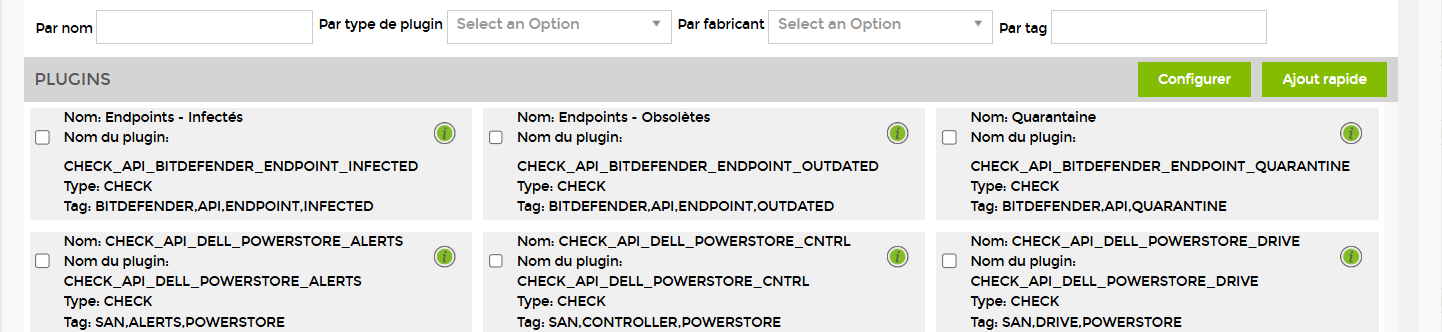
A search engine allows you to quickly find the right plug-in based on the manufacturer, publisher, type, or a specific term.
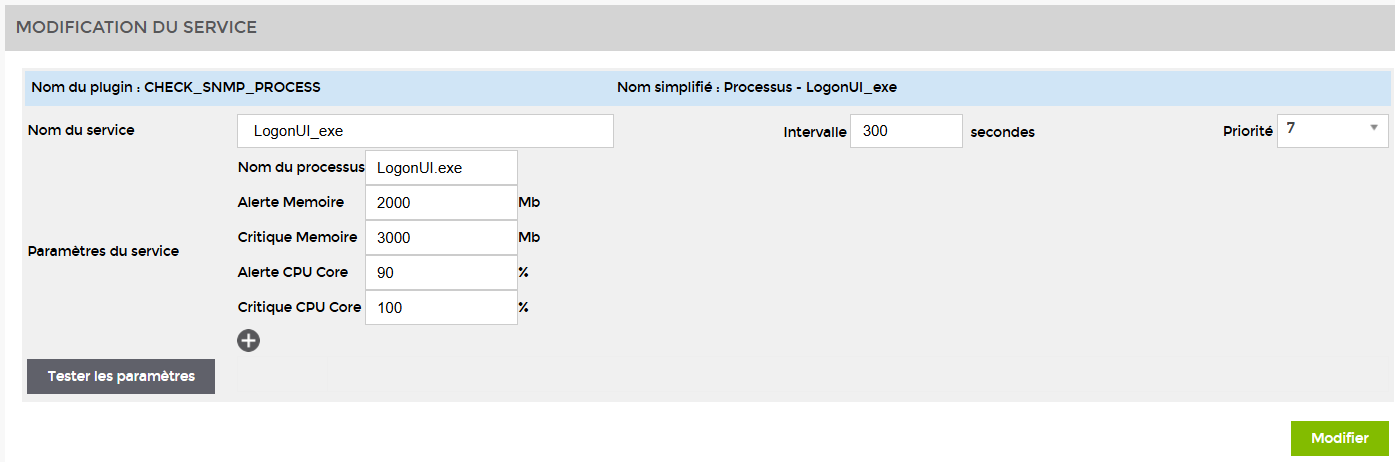
Each of our monitoring plug-ins has settings that can be easily modified in our interface with just a few clicks.
History
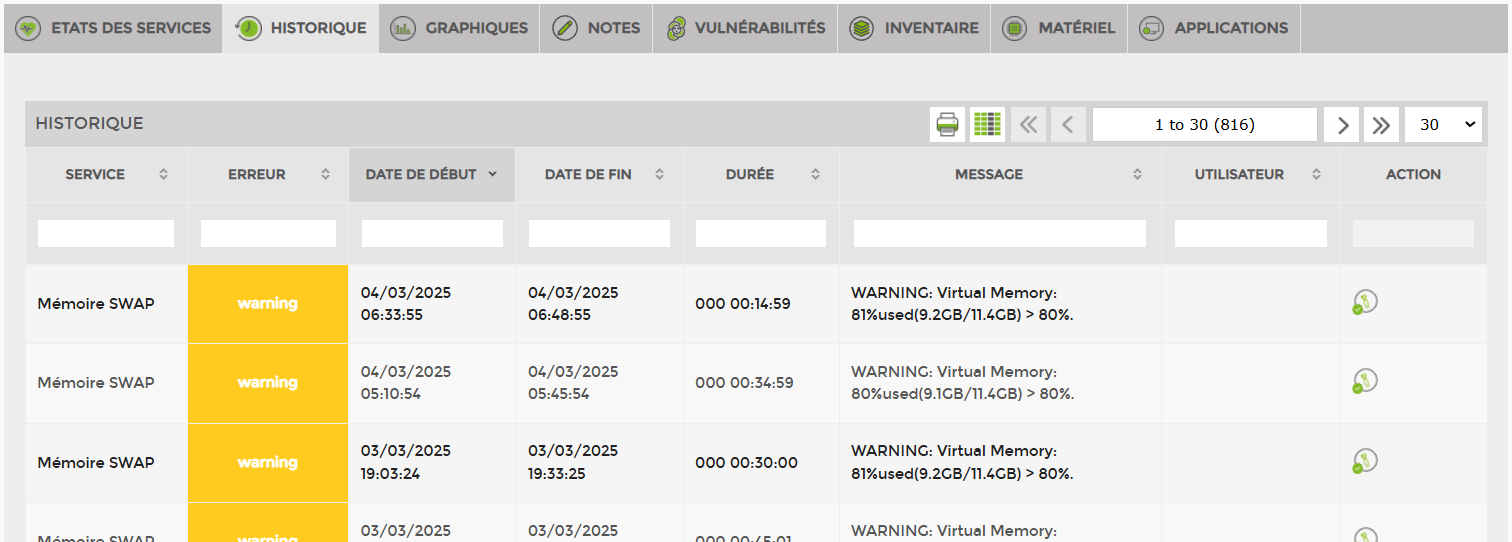
Each event is logged in a history for a minimum period of one year, and this retention period may be extended. The information available to you includes: the service experiencing the error, the start and end dates of the error, its duration, and a message specifying the nature of the error. If actions have been initiated by your technical team, such as maintenance or acknowledgement, this information is indicated under the action tab.
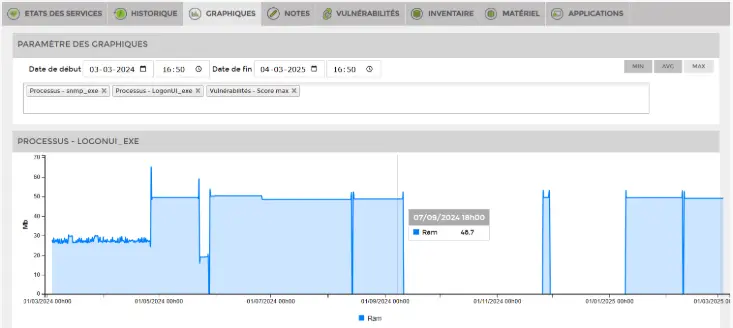
Numerous plug-ins allow you to generate graphs. You can customise the selection of these according to your needs and display them in your interface. For example, you can define a specific time range in order to analyse and correlate information from several different graphs.
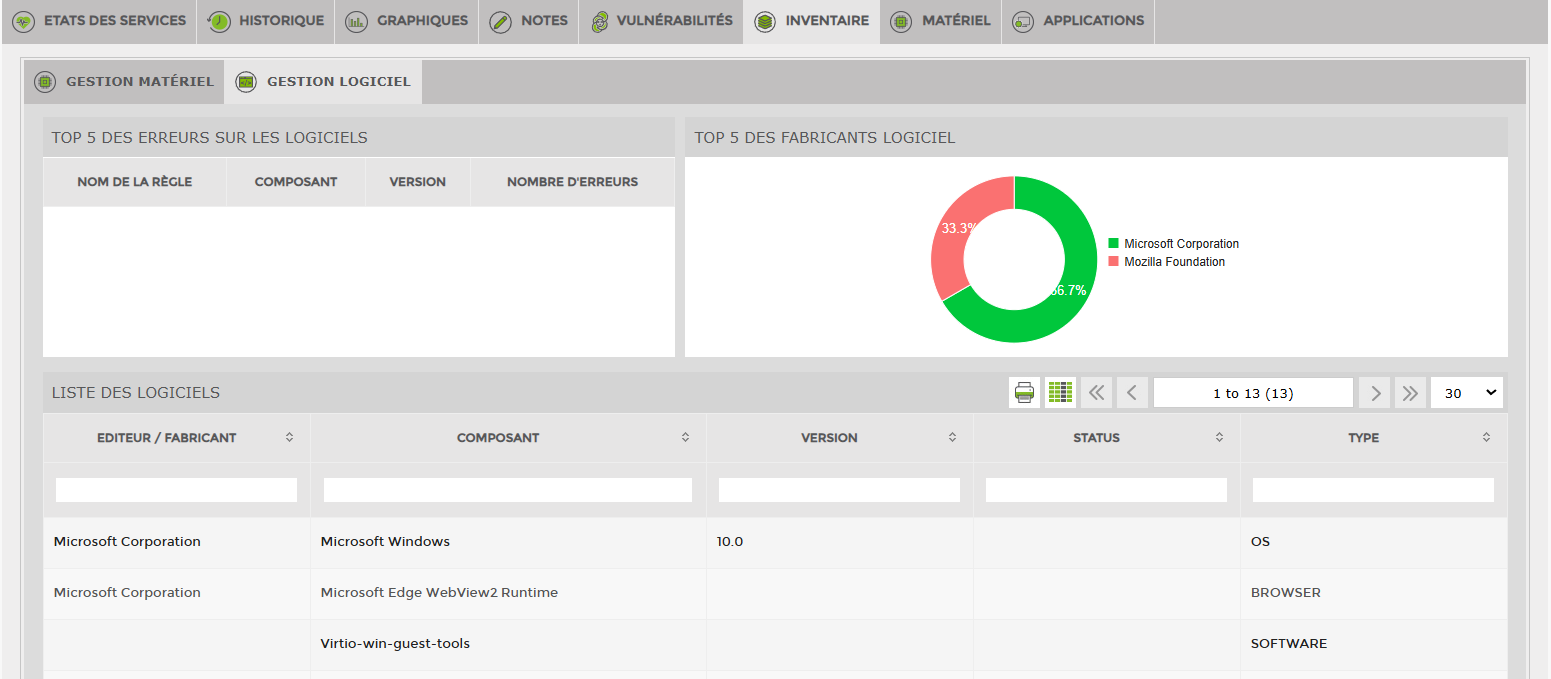
Inventory
A hardware and software inventory of the server is available to you, providing the following information: publisher or manufacturer, component type, version, description or type.
The data available to you includes: the publisher, the software version, and the type. This makes it easier for you to carry out your inventory for NIS2 or ISO 27001.
If you have a Svalinn licence, you can centralise data even more efficiently with the inventory module.
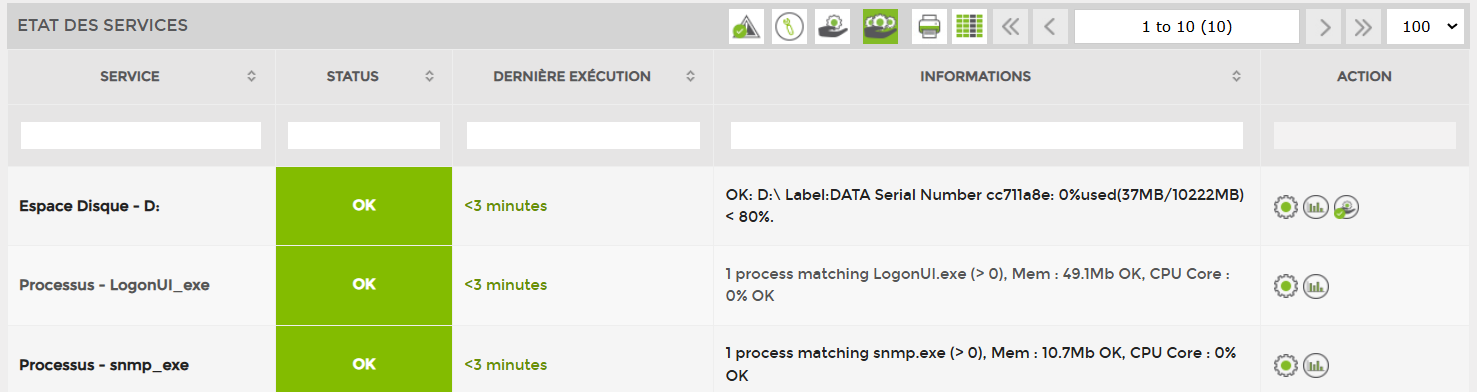
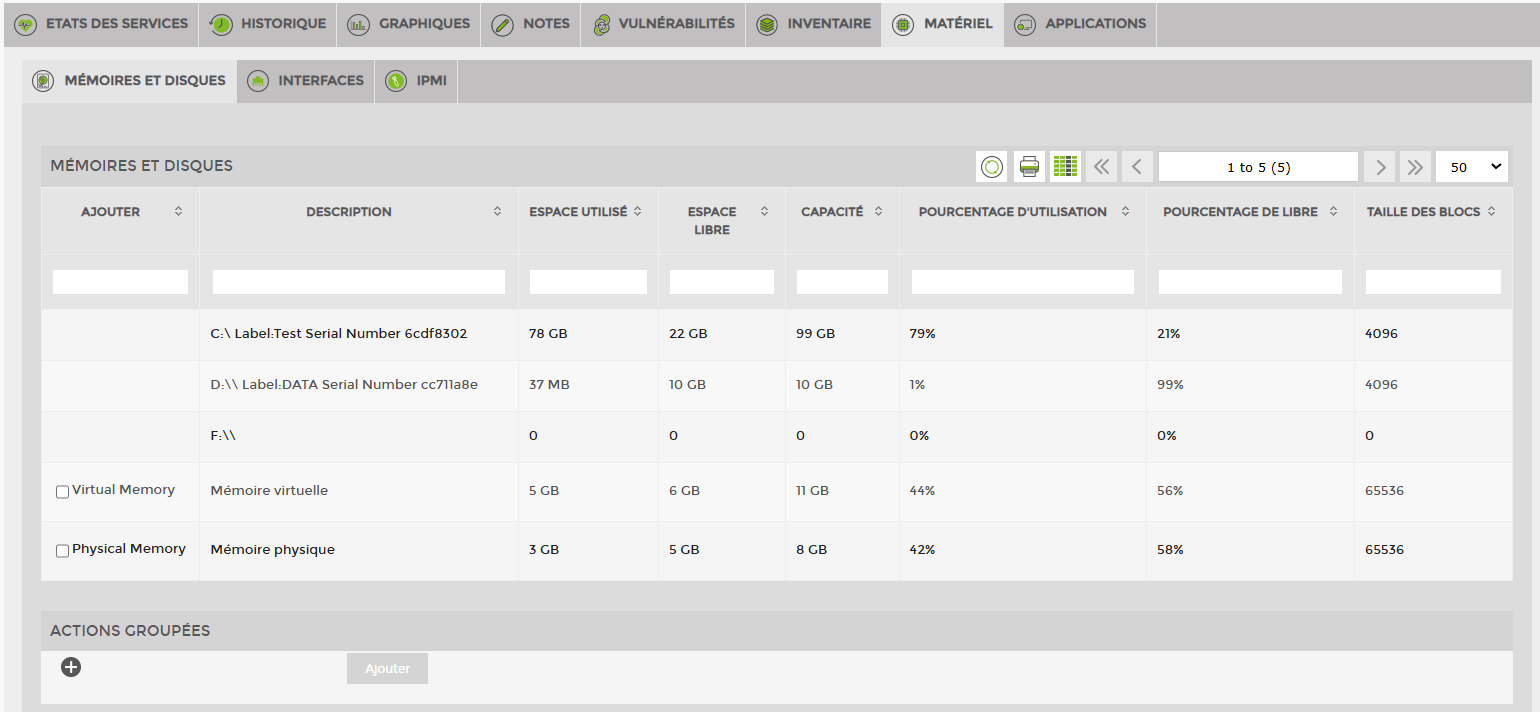
Storage space & disks
Monitoring the hardware layer is greatly facilitated by ESIA. Simply select a specific disk, volume or network interface, and monitoring will begin with a single click after confirming your choice.
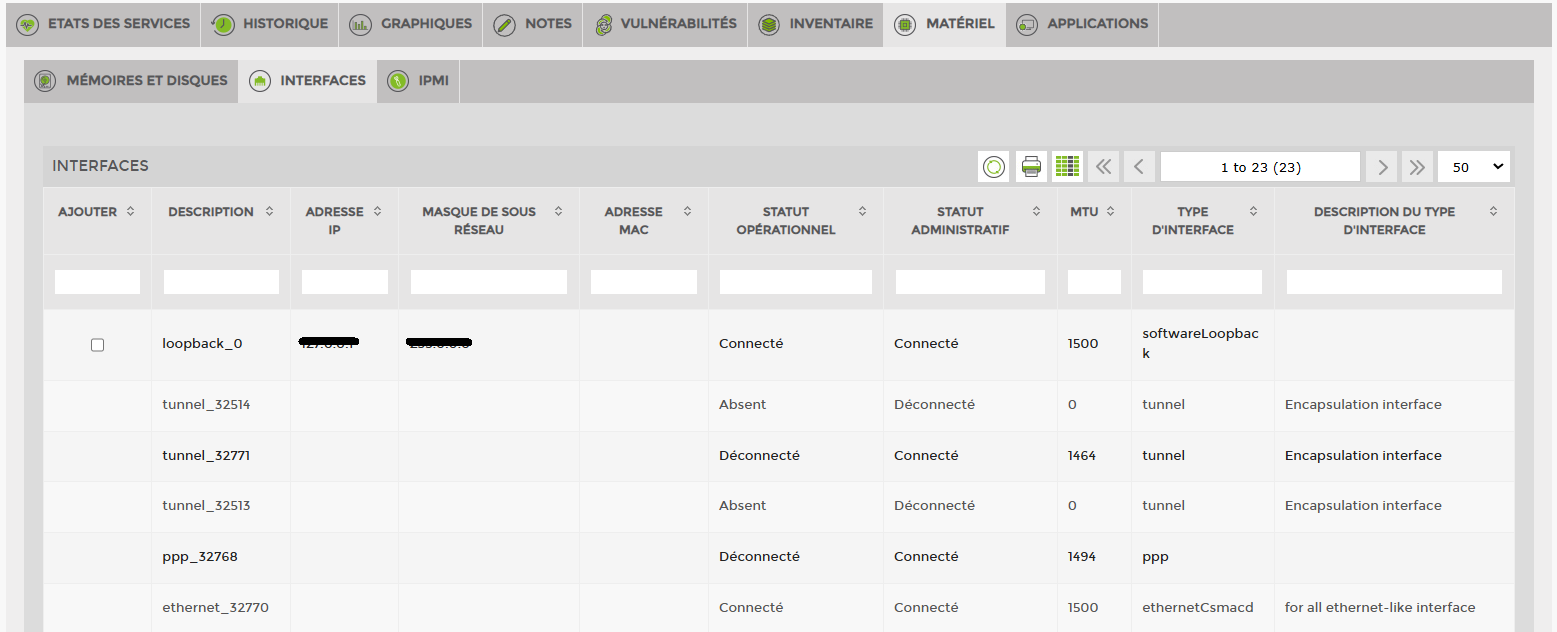
Bandwidth
The following information is available on your server interfaces:
Description, IP address, subnet mask, MAC address, operational and administrative status, MTU, interface type, and description.
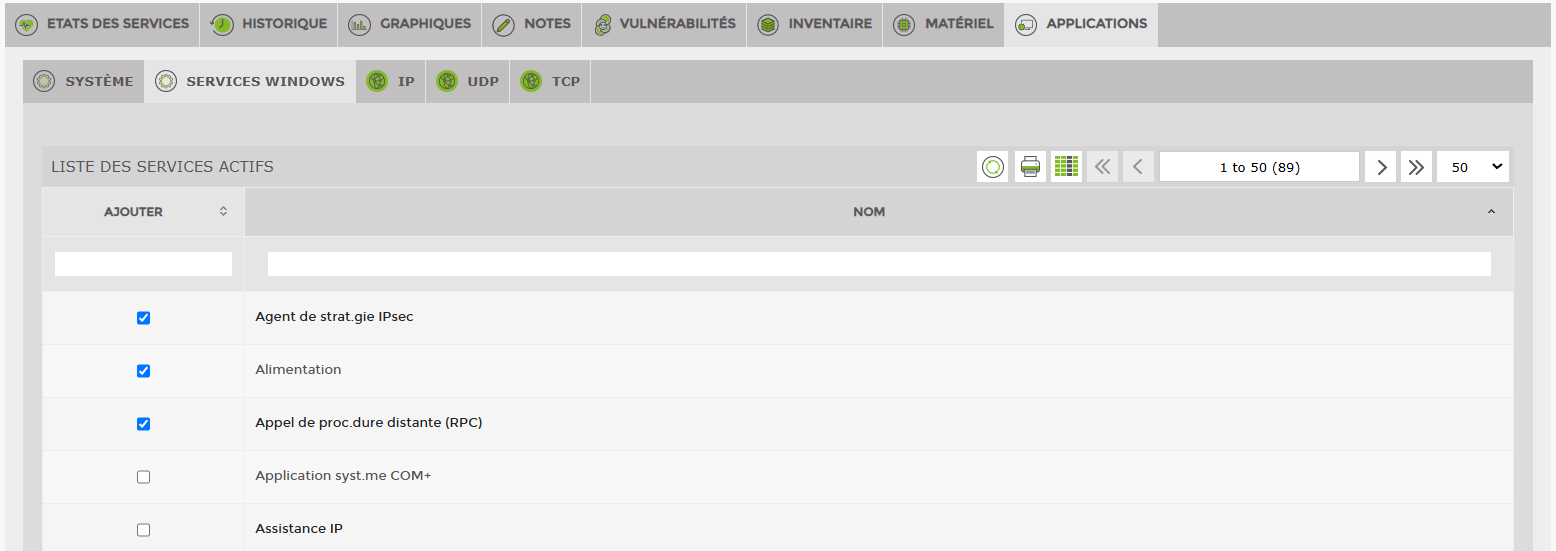
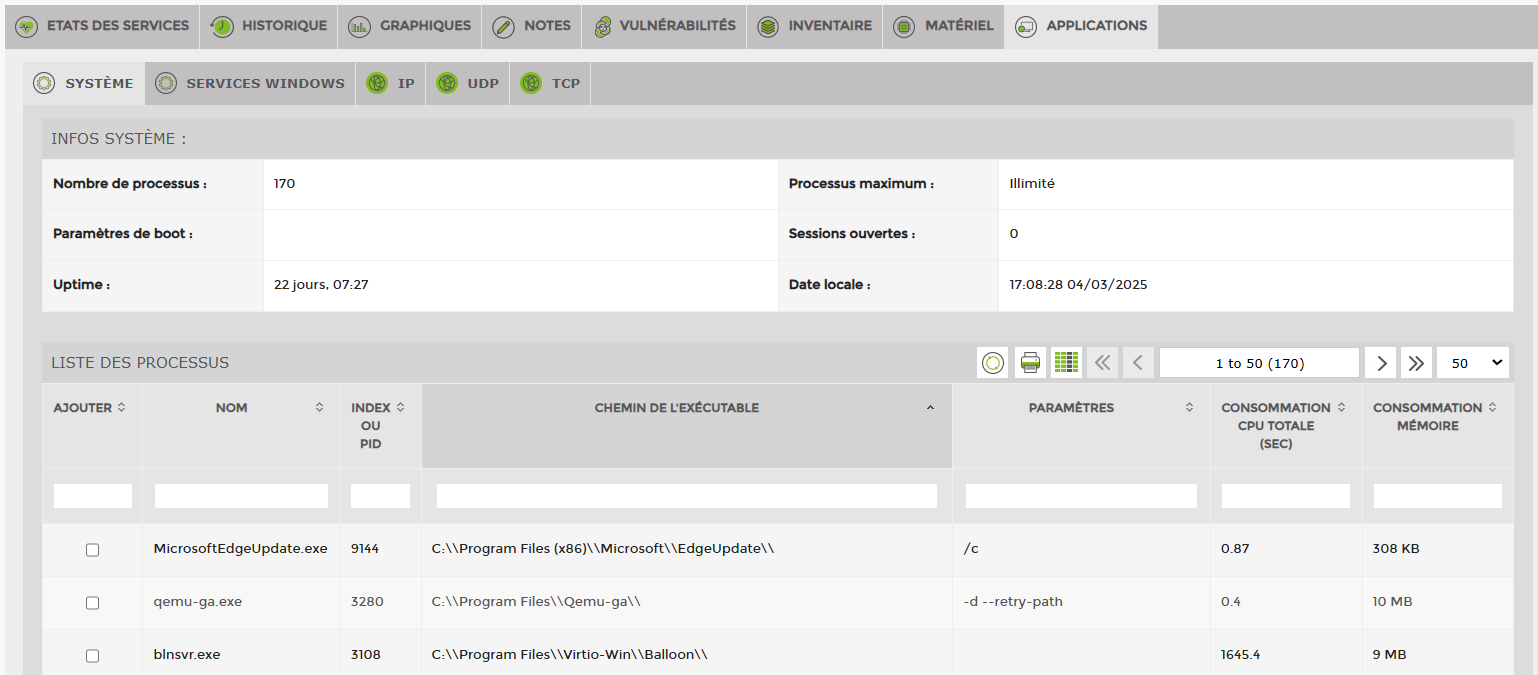
Process supervision
Application monitoring of your server gives you access to all information about your operating system and the services that comprise it. From this view, you can simply select a service and start monitoring it with a single click.
Windows monitoring service
Regardless of your operating system, ESIA simplifies the management and administration of your servers. Whether you are using Linux, Windows, or Apple, simply selecting an aspect in our interface allows you to start monitoring it in a matter of seconds.